Most BI tools treat your database as a collection of flat tables. They’re designed for rows and columns - not for graphs, time series, or documents. If you’re running ArcadeDB, you know your data is richer than that.
Today we’re releasing the ArcadeDB Grafana data source plugin - a native Go backend plugin that brings the full power of ArcadeDB’s multi-model engine to Grafana dashboards. Query with SQL, Cypher, or Gremlin. Visualize graphs as interactive network diagrams. Monitor time series with auto-discovered metrics. Set up alerts. All from one plugin.
Why a Native Go Plugin Matters
This isn’t a generic REST connector or a workaround using the PostgreSQL data source. The ArcadeDB plugin is built with Grafana’s official plugin SDK, with a Go backend that runs server-side. That architectural choice unlocks capabilities that frontend-only plugins simply cannot provide:
- Grafana Alerting - Create alert rules on any query. The backend evaluates queries server-side, so alerts fire even when no browser is open.
- Secure Credentials - Your ArcadeDB username and password never reach the browser. The Go backend handles authentication directly.
- Query Caching - Grafana’s built-in caching works out of the box.
- Server-Side Query Execution - No CORS issues, no browser timeouts on heavy queries.
Four Query Modes, One Plugin
- SQL - Full ArcadeDB SQL with graph traversal functions (
out(),in(),both()), syntax highlighting, and macro support. Results render as tables, bar charts, pie charts, or any Grafana visualization. - Cypher - OpenCypher pattern matching with optional Node Graph toggle for interactive graph visualization. Vertices become clickable nodes, edges become connections.
- Gremlin - Apache TinkerPop traversals with the same Node Graph support as Cypher.
- Time Series - Visual query builder that auto-discovers types, fields, and tags from ArcadeDB’s time series engine. No query language required.
Tutorial: Your First ArcadeDB Dashboard
Let’s build a dashboard with three panels using ArcadeDB’s MovieRatings demo database: a SQL bar chart showing top-rated movies, a SQL table with graph traversal, and a Cypher graph visualization of movie-genre relationships.
Prerequisites
- Docker installed and running
- A web browser
That’s it. We’ll run everything in Docker.
Step 1: Start ArcadeDB and Grafana with Docker
Start ArcadeDB:
docker run --rm -d --name arcadedb \
  -p 2480:2480 -p 2424:2424 \
  -e JAVA_OPTS="-Darcadedb.server.rootPassword=arcadedb" \
  arcadedata/arcadedb:latest
Start Grafana with the ArcadeDB plugin:
docker run --rm -d --name grafana \
  -p 3000:3000 \
  -e GF_PLUGINS_ALLOW_LOADING_UNSIGNED_PLUGINS=arcadedb-arcadedb-datasource \
  -e GF_INSTALL_PLUGINS="https://github.com/ArcadeData/arcadedb-grafana-datasource/releases/latest/download/arcadedb-arcadedb-datasource.zip;arcadedb-arcadedb-datasource" \
  grafana/grafana:latest
Once both containers are running:
- ArcadeDB Studio: http://localhost:2480 (user:
root, password:arcadedb) - Grafana: http://localhost:3000 (user:
admin, password:admin)
Step 2: Configure the Data Source
In Grafana, go to Connections > Data Sources > Add data source and search for ArcadeDB.
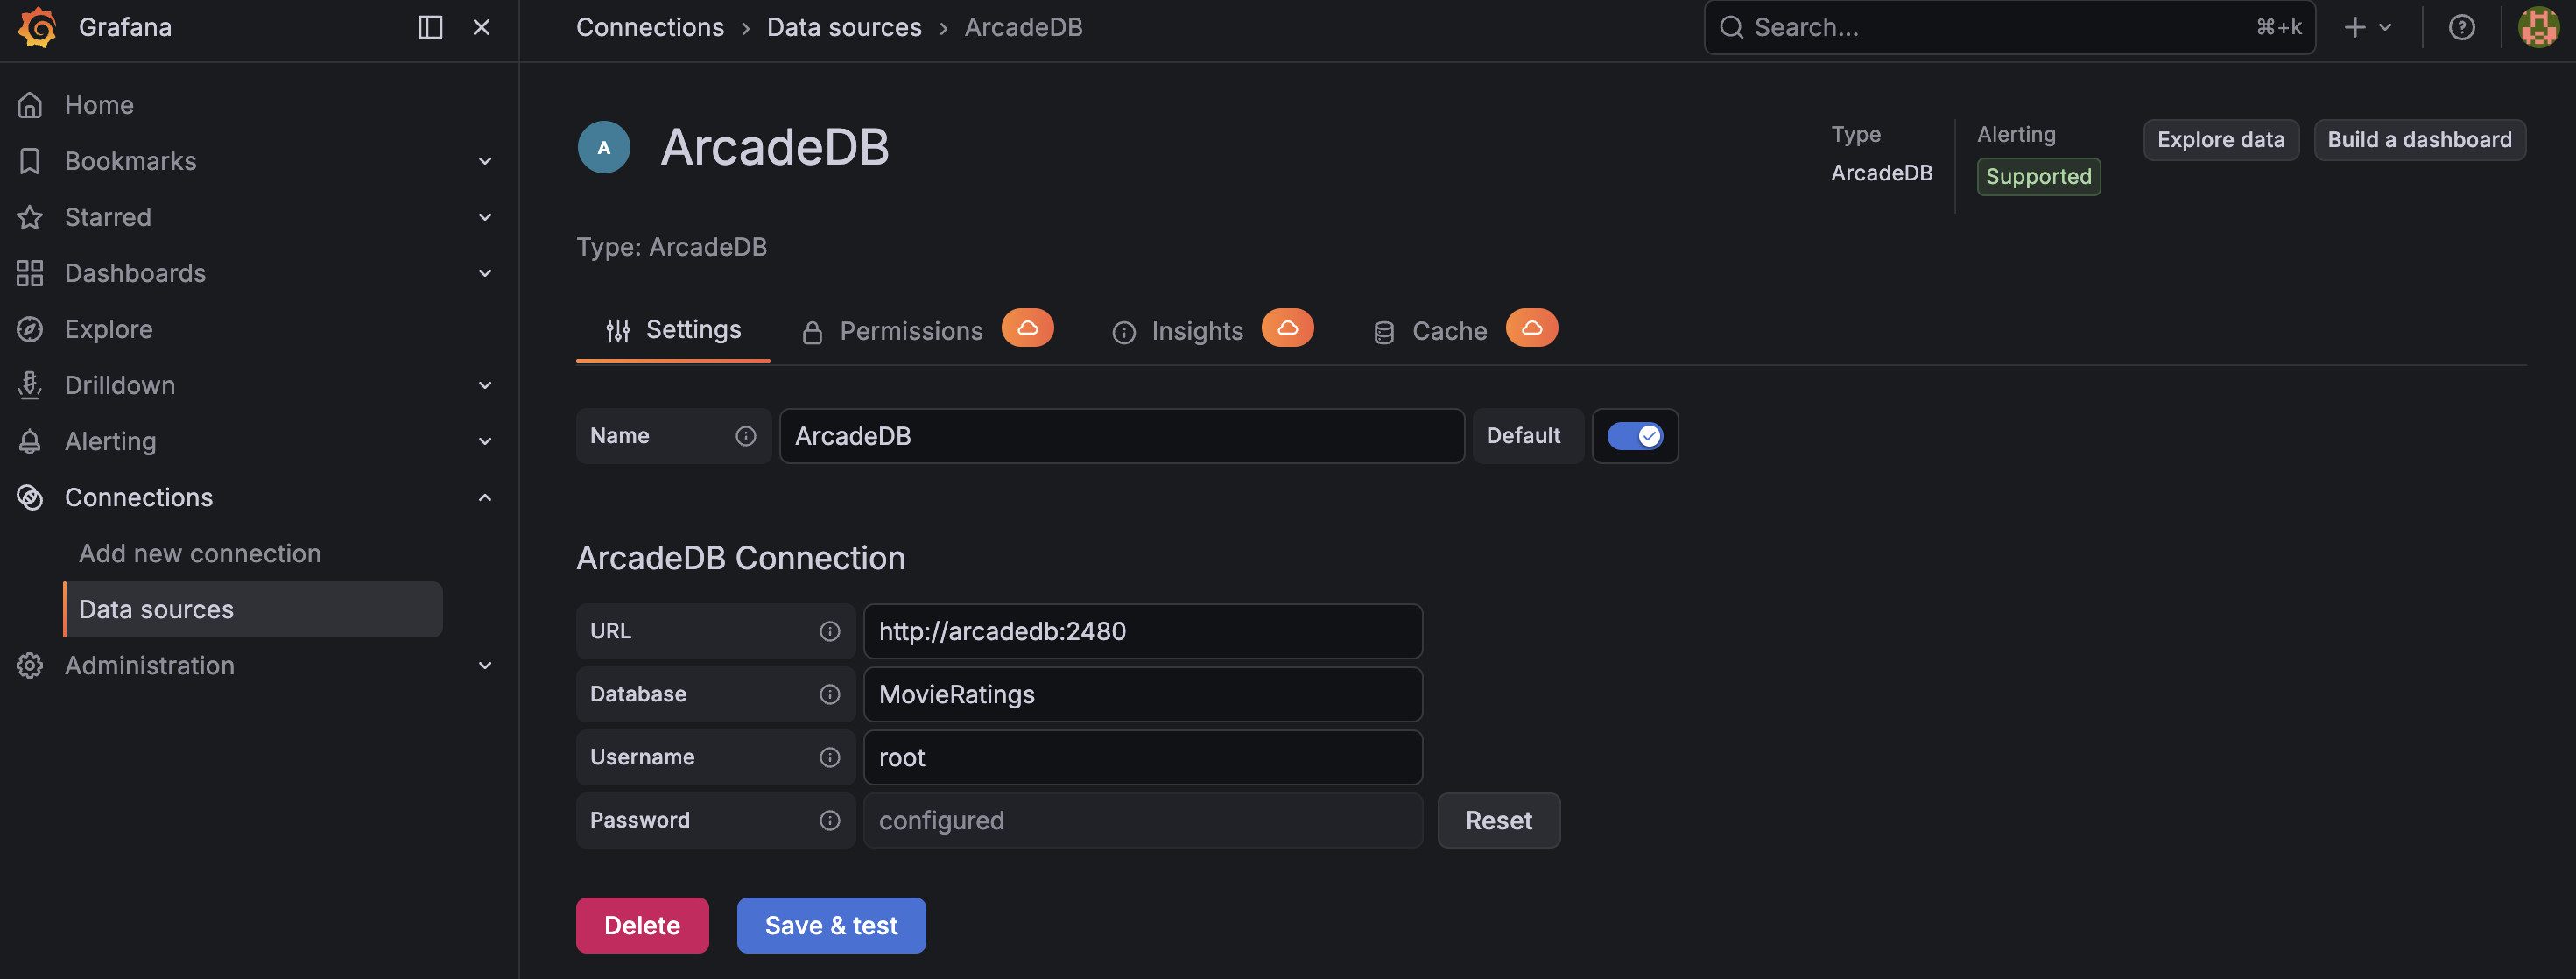
Fill in:
- URL:
http://host.docker.internal:2480(this lets the Grafana container reach ArcadeDB on your host) - Database:
MovieRatings - Username:
root - Password:
arcadedb
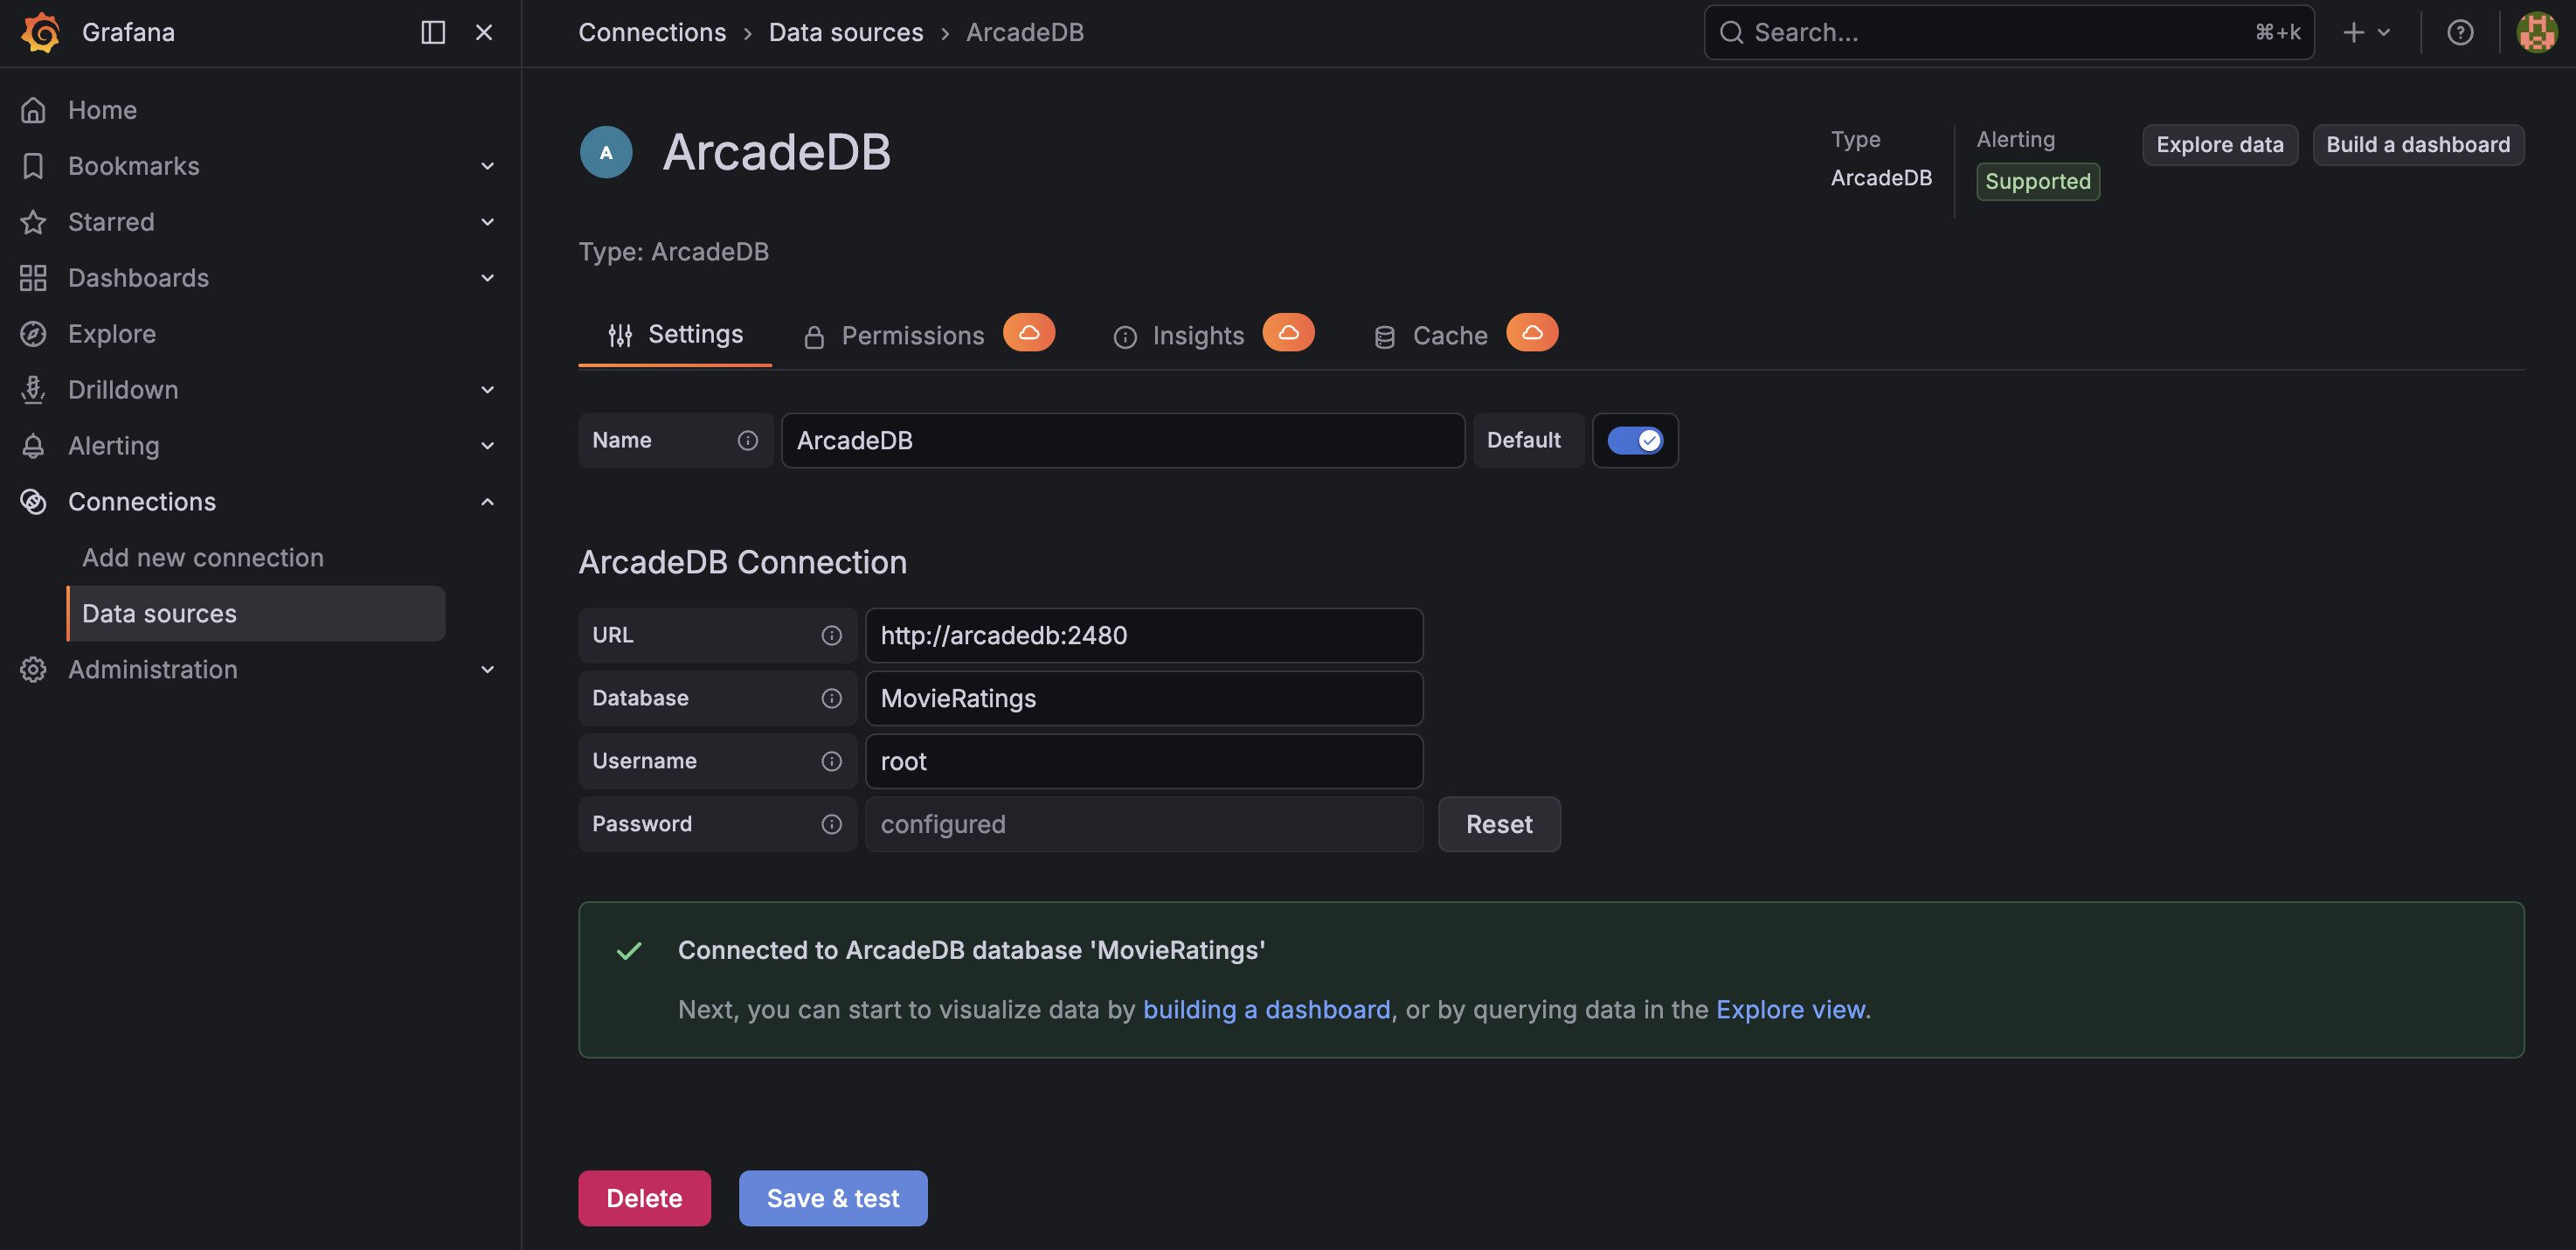
Click Save & Test. You should see a green success message.
Step 3: Load the Demo Database
Open ArcadeDB Studio at http://localhost:2480 and create the MovieRatings database from the demo databases.
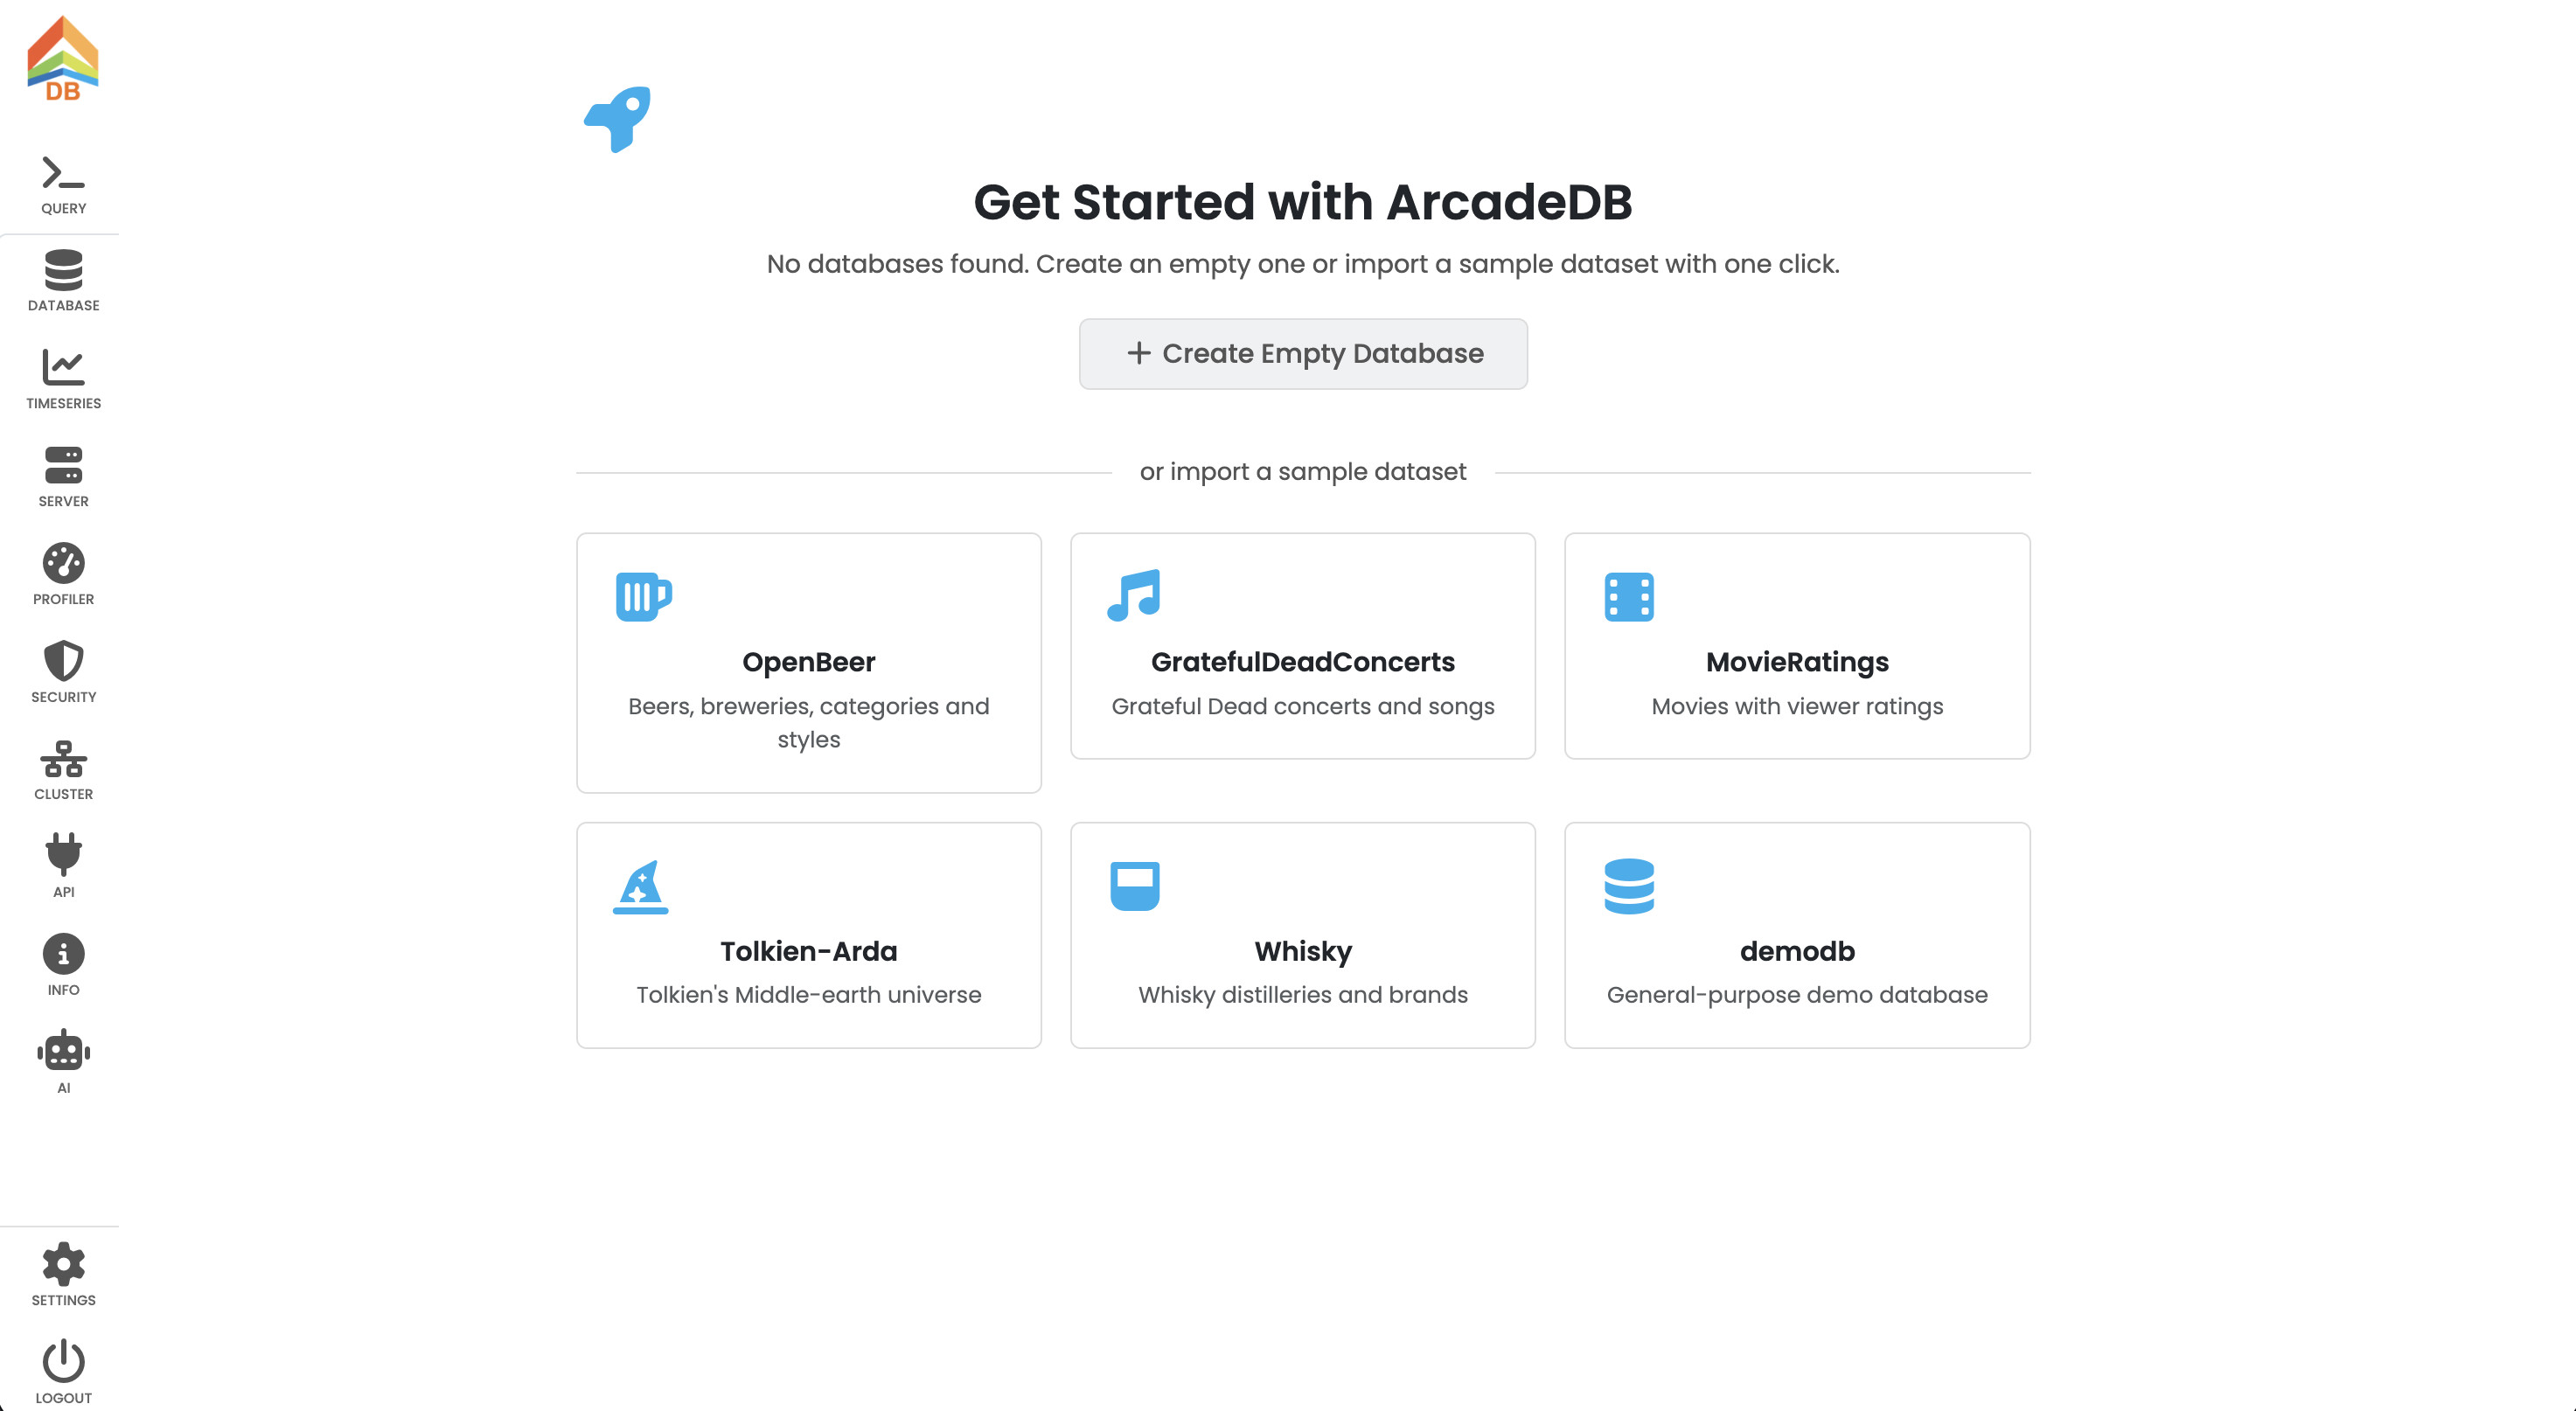
This dataset contains 3,883 movies, 6,040 users, and over 1 million ratings - a real-world graph with vertices (Movies, Users, Genres, Occupations) connected by edges (rated, hasGenera, hasOccupation).
Step 4: SQL Panel - Bar Chart
Create a new dashboard and add a visualization. Select the ArcadeDB data source.
- Set the mode to SQL.
- Enter this query to find the top 20 most-rated movies:
SELECT title.left(30) AS title, in('rated').size() AS ratings
FROM Movies
ORDER BY ratings DESC
LIMIT 5
- Change the visualization type (top right) to Bar chart.
- Run the query.
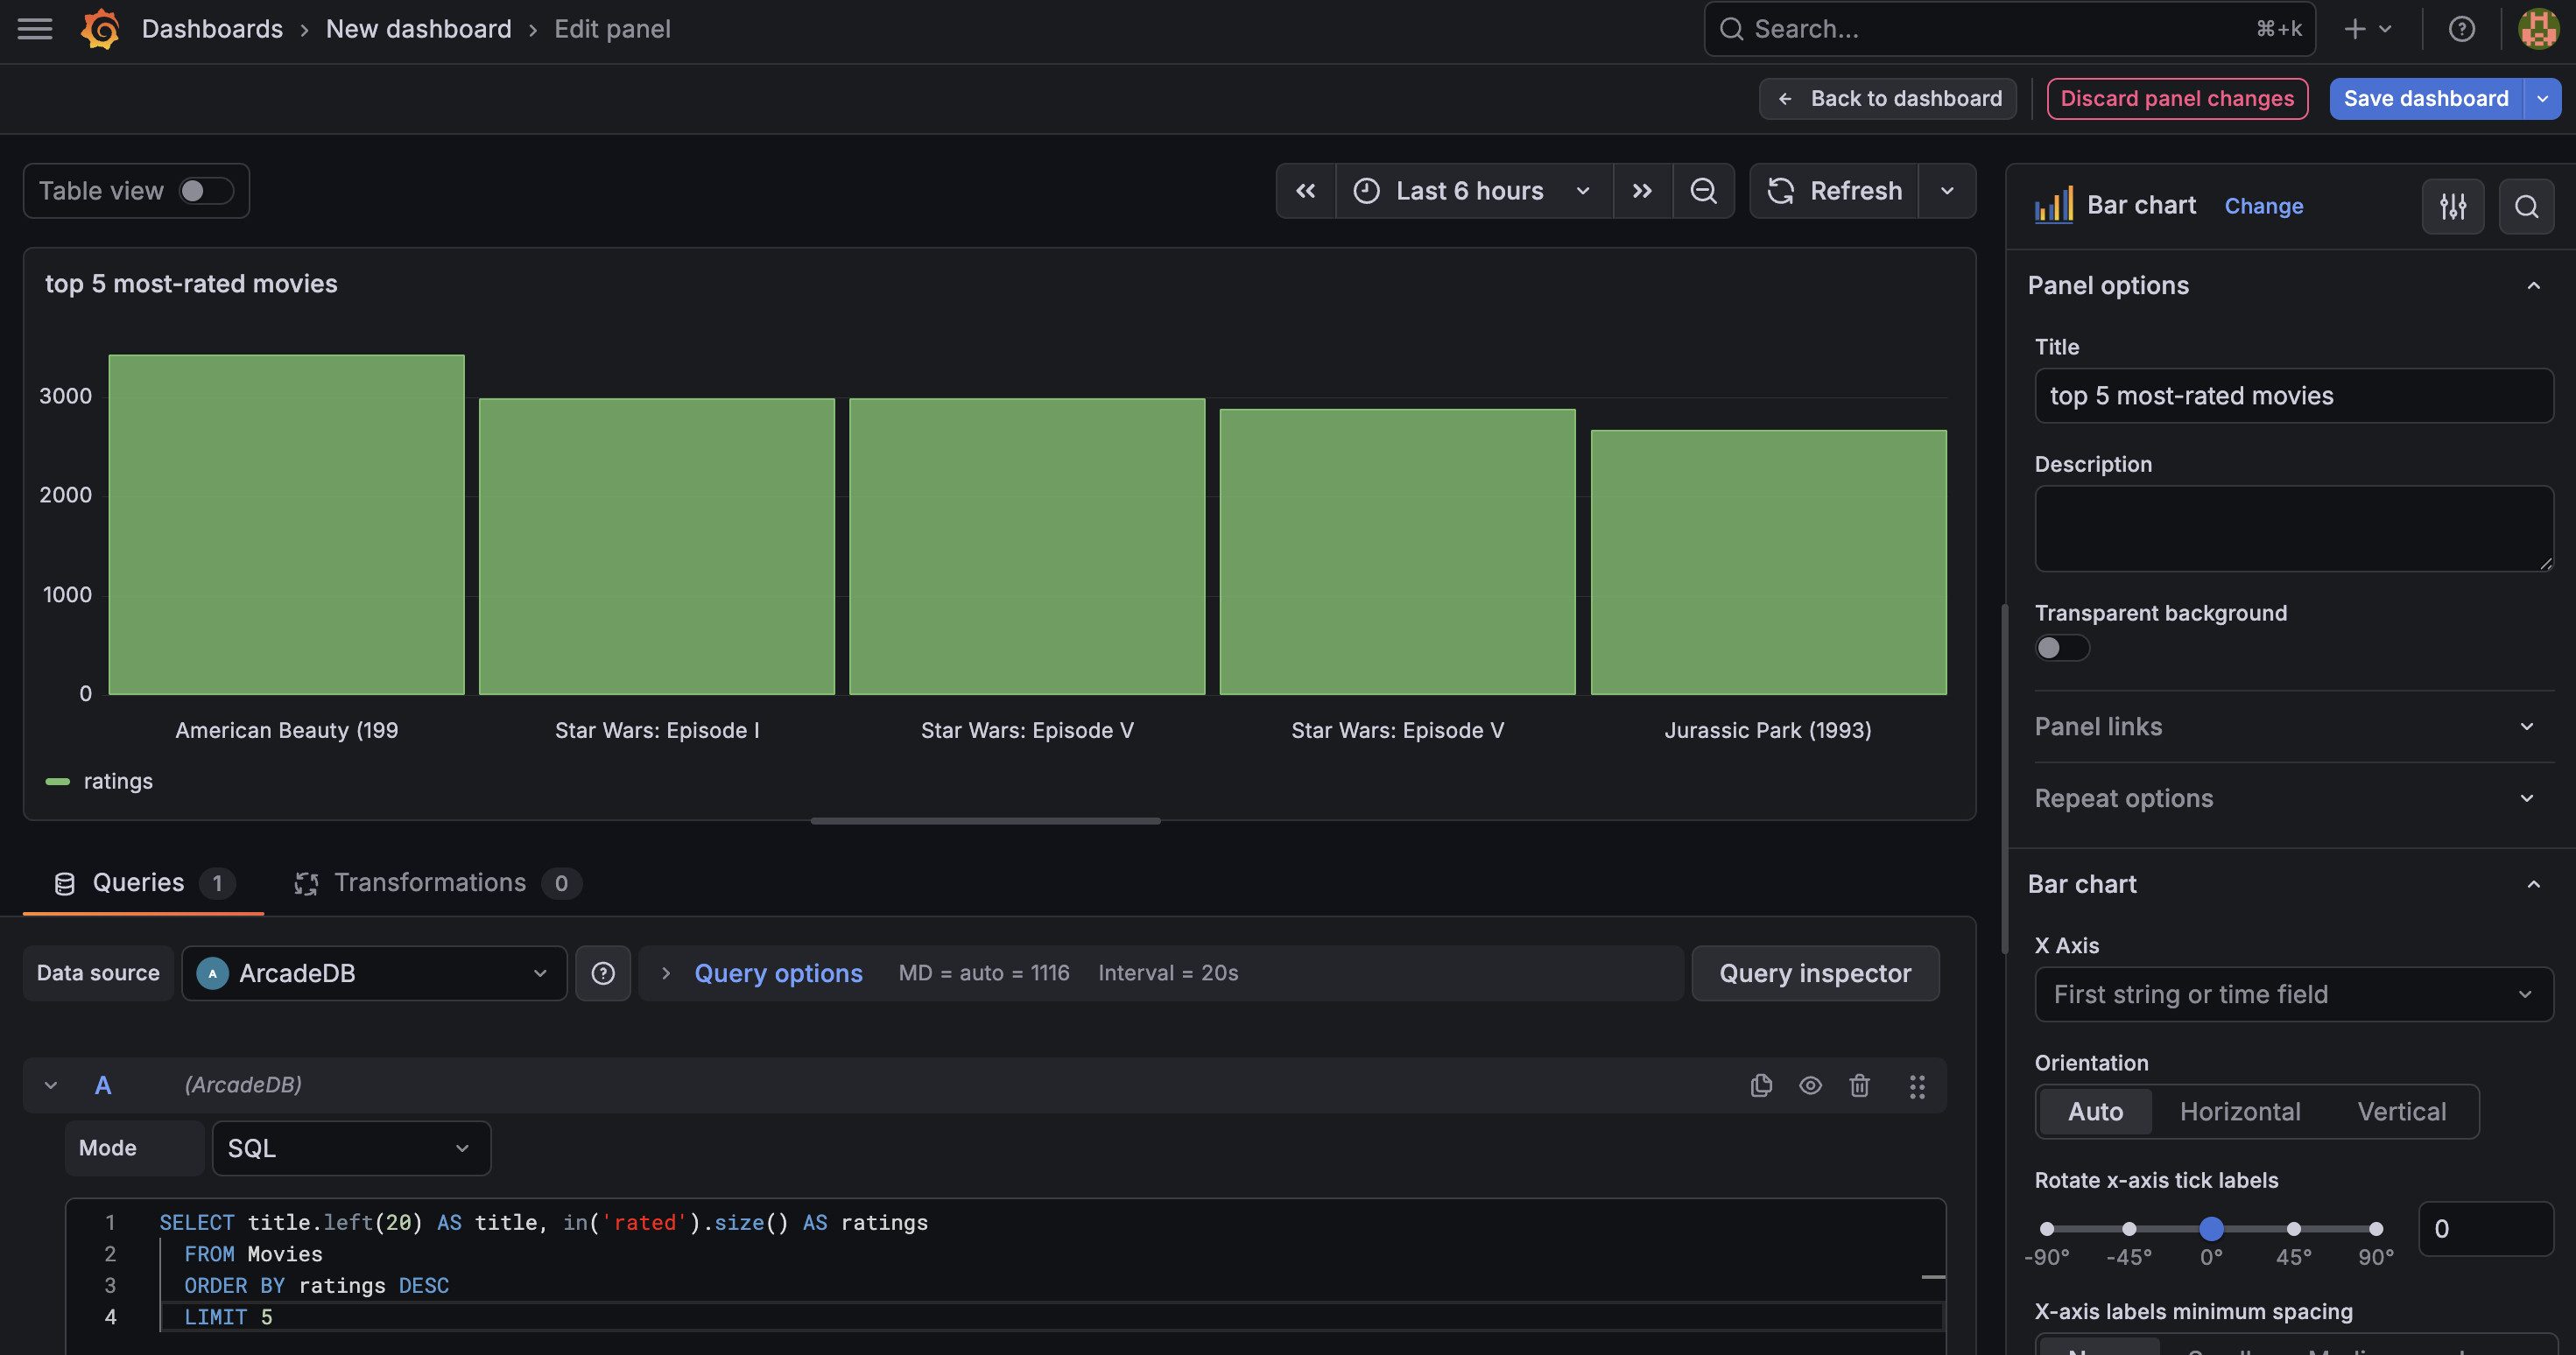
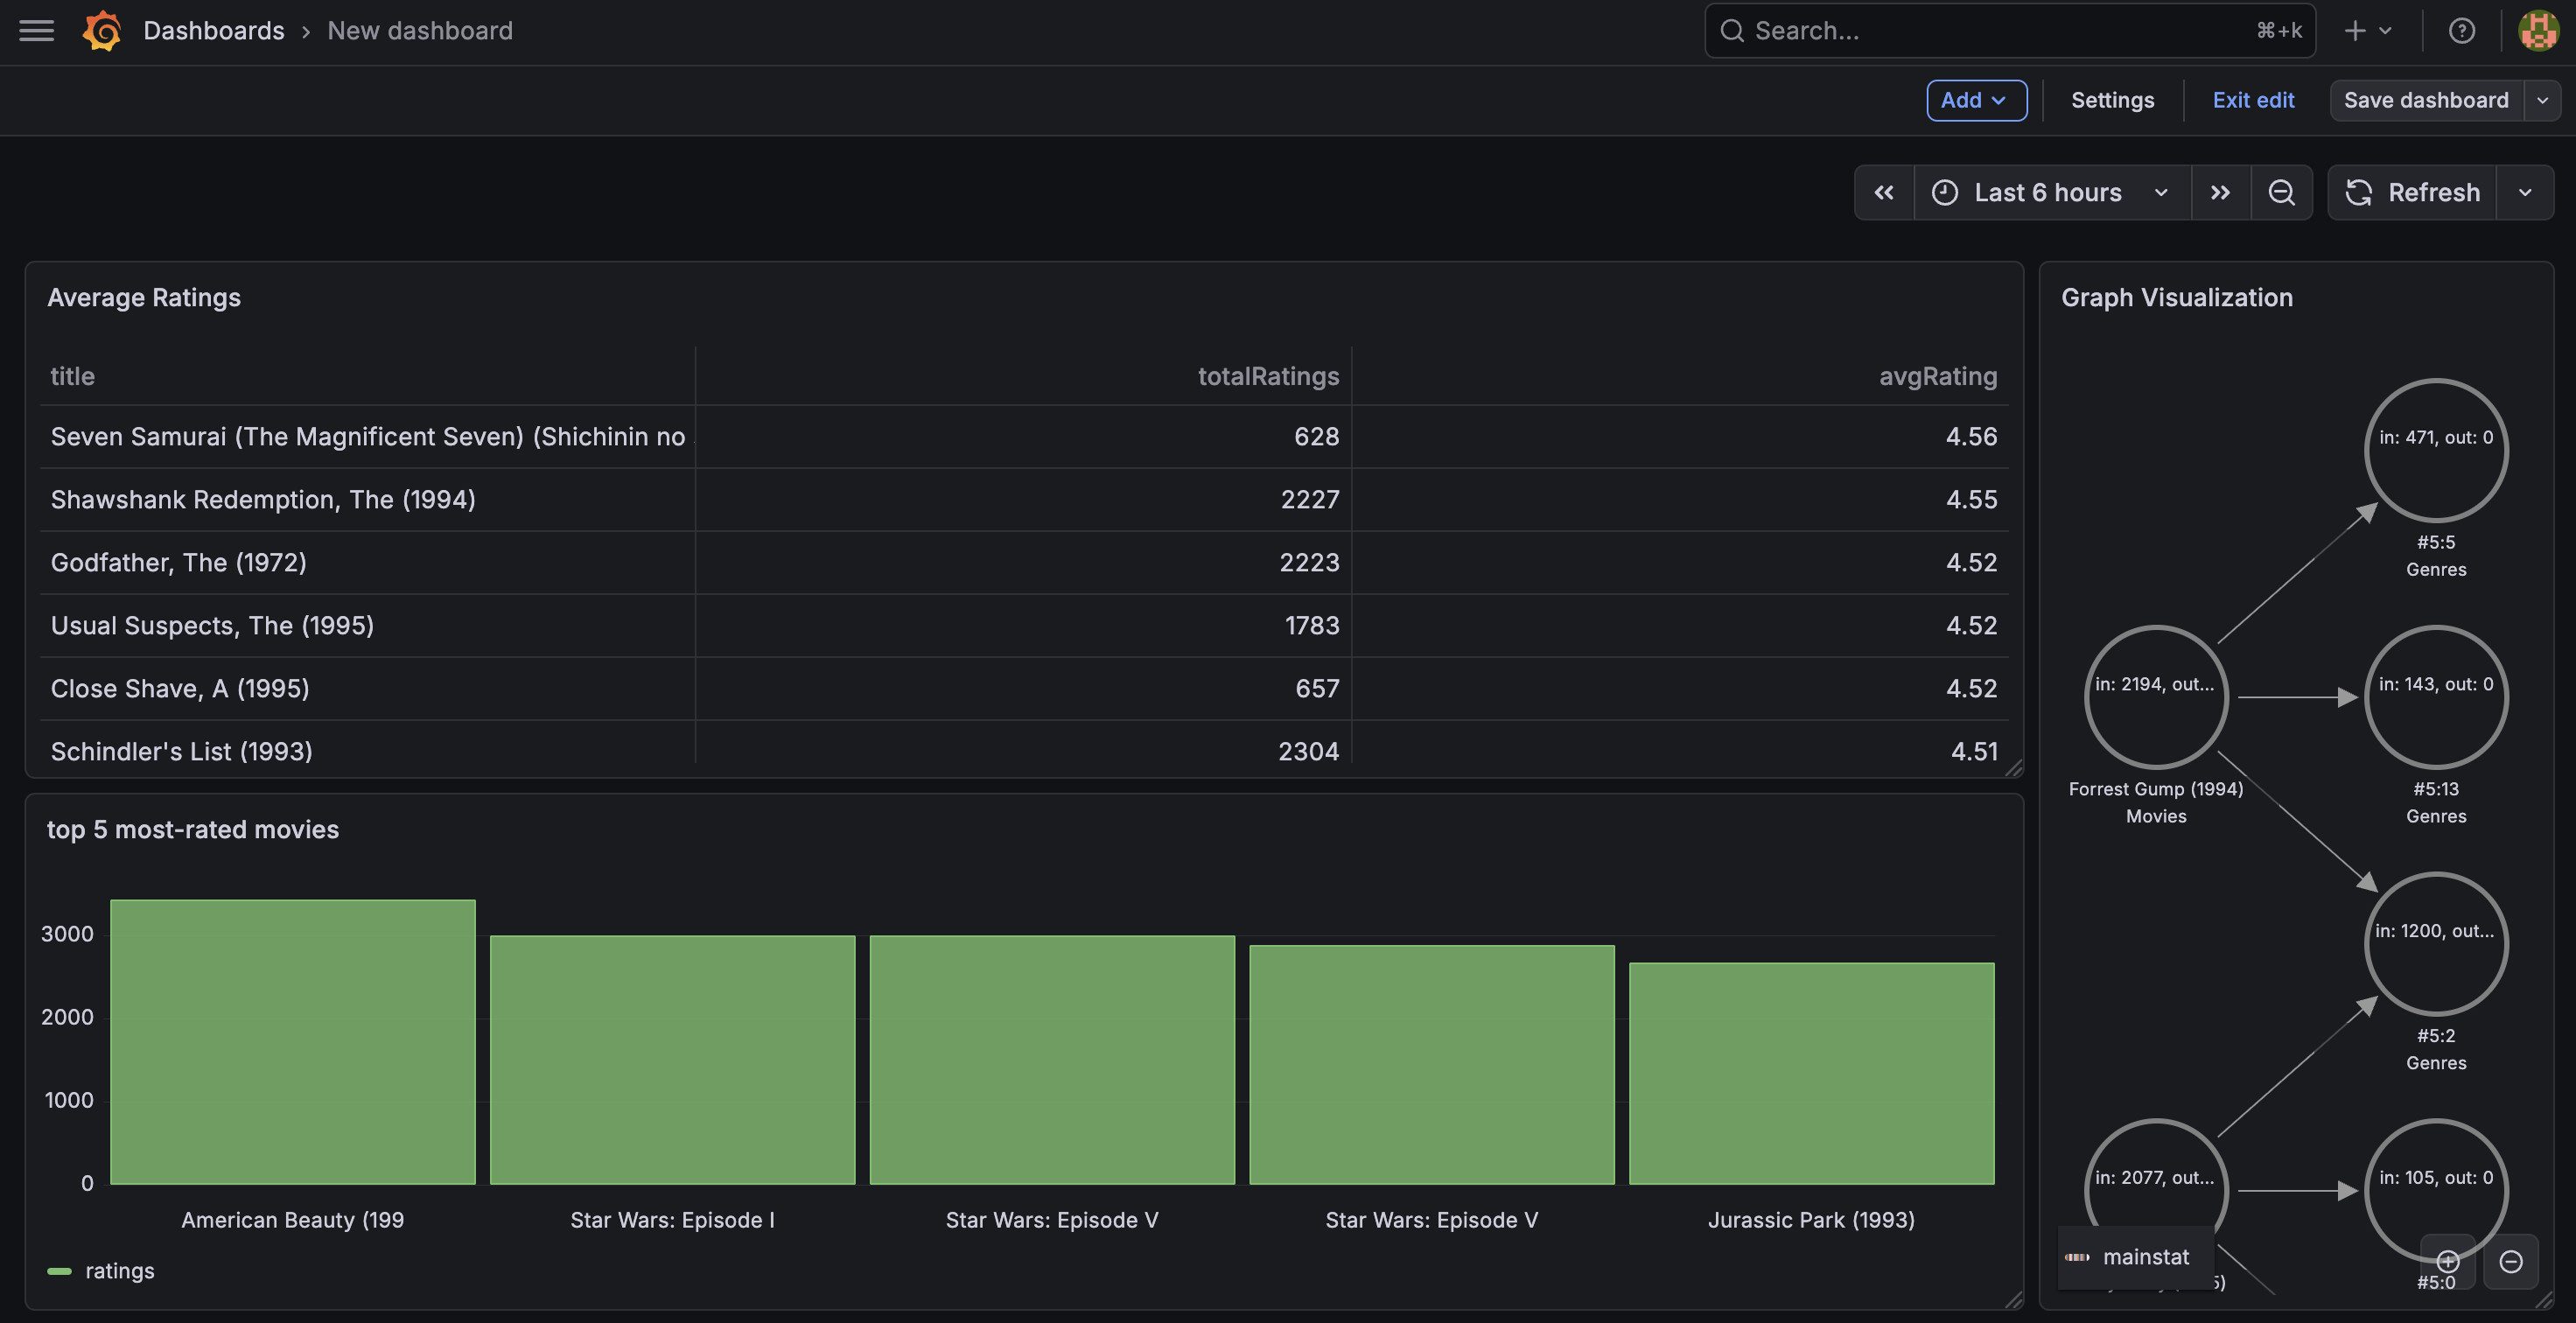
You should see a bar chart with the five most-rated movies. “American Beauty” and “Star Wars” should be at the top. This uses ArcadeDB’s in() graph traversal function directly in SQL - no joins needed.
Step 5: Cypher Panel - Table with Average Ratings
Add another visualization for a detailed table view. This time we’ll use Cypher, which is ideal for traversing relationships and aggregating edge properties.
- Set mode to Cypher.
- Enter this query to find the highest-rated movies (with at least 100 ratings):
MATCH (m:Movies)<-[r:rated]-(u:Users)
WITH m, count(r) AS totalRatings, avg(r.rating) AS avgRating
WHERE totalRatings >= 100
RETURN m.title AS title, totalRatings, round(avgRating * 100) / 100 AS avgRating
ORDER BY avgRating DESC
LIMIT 20
- Change the visualization type to Table.
- Run the query.
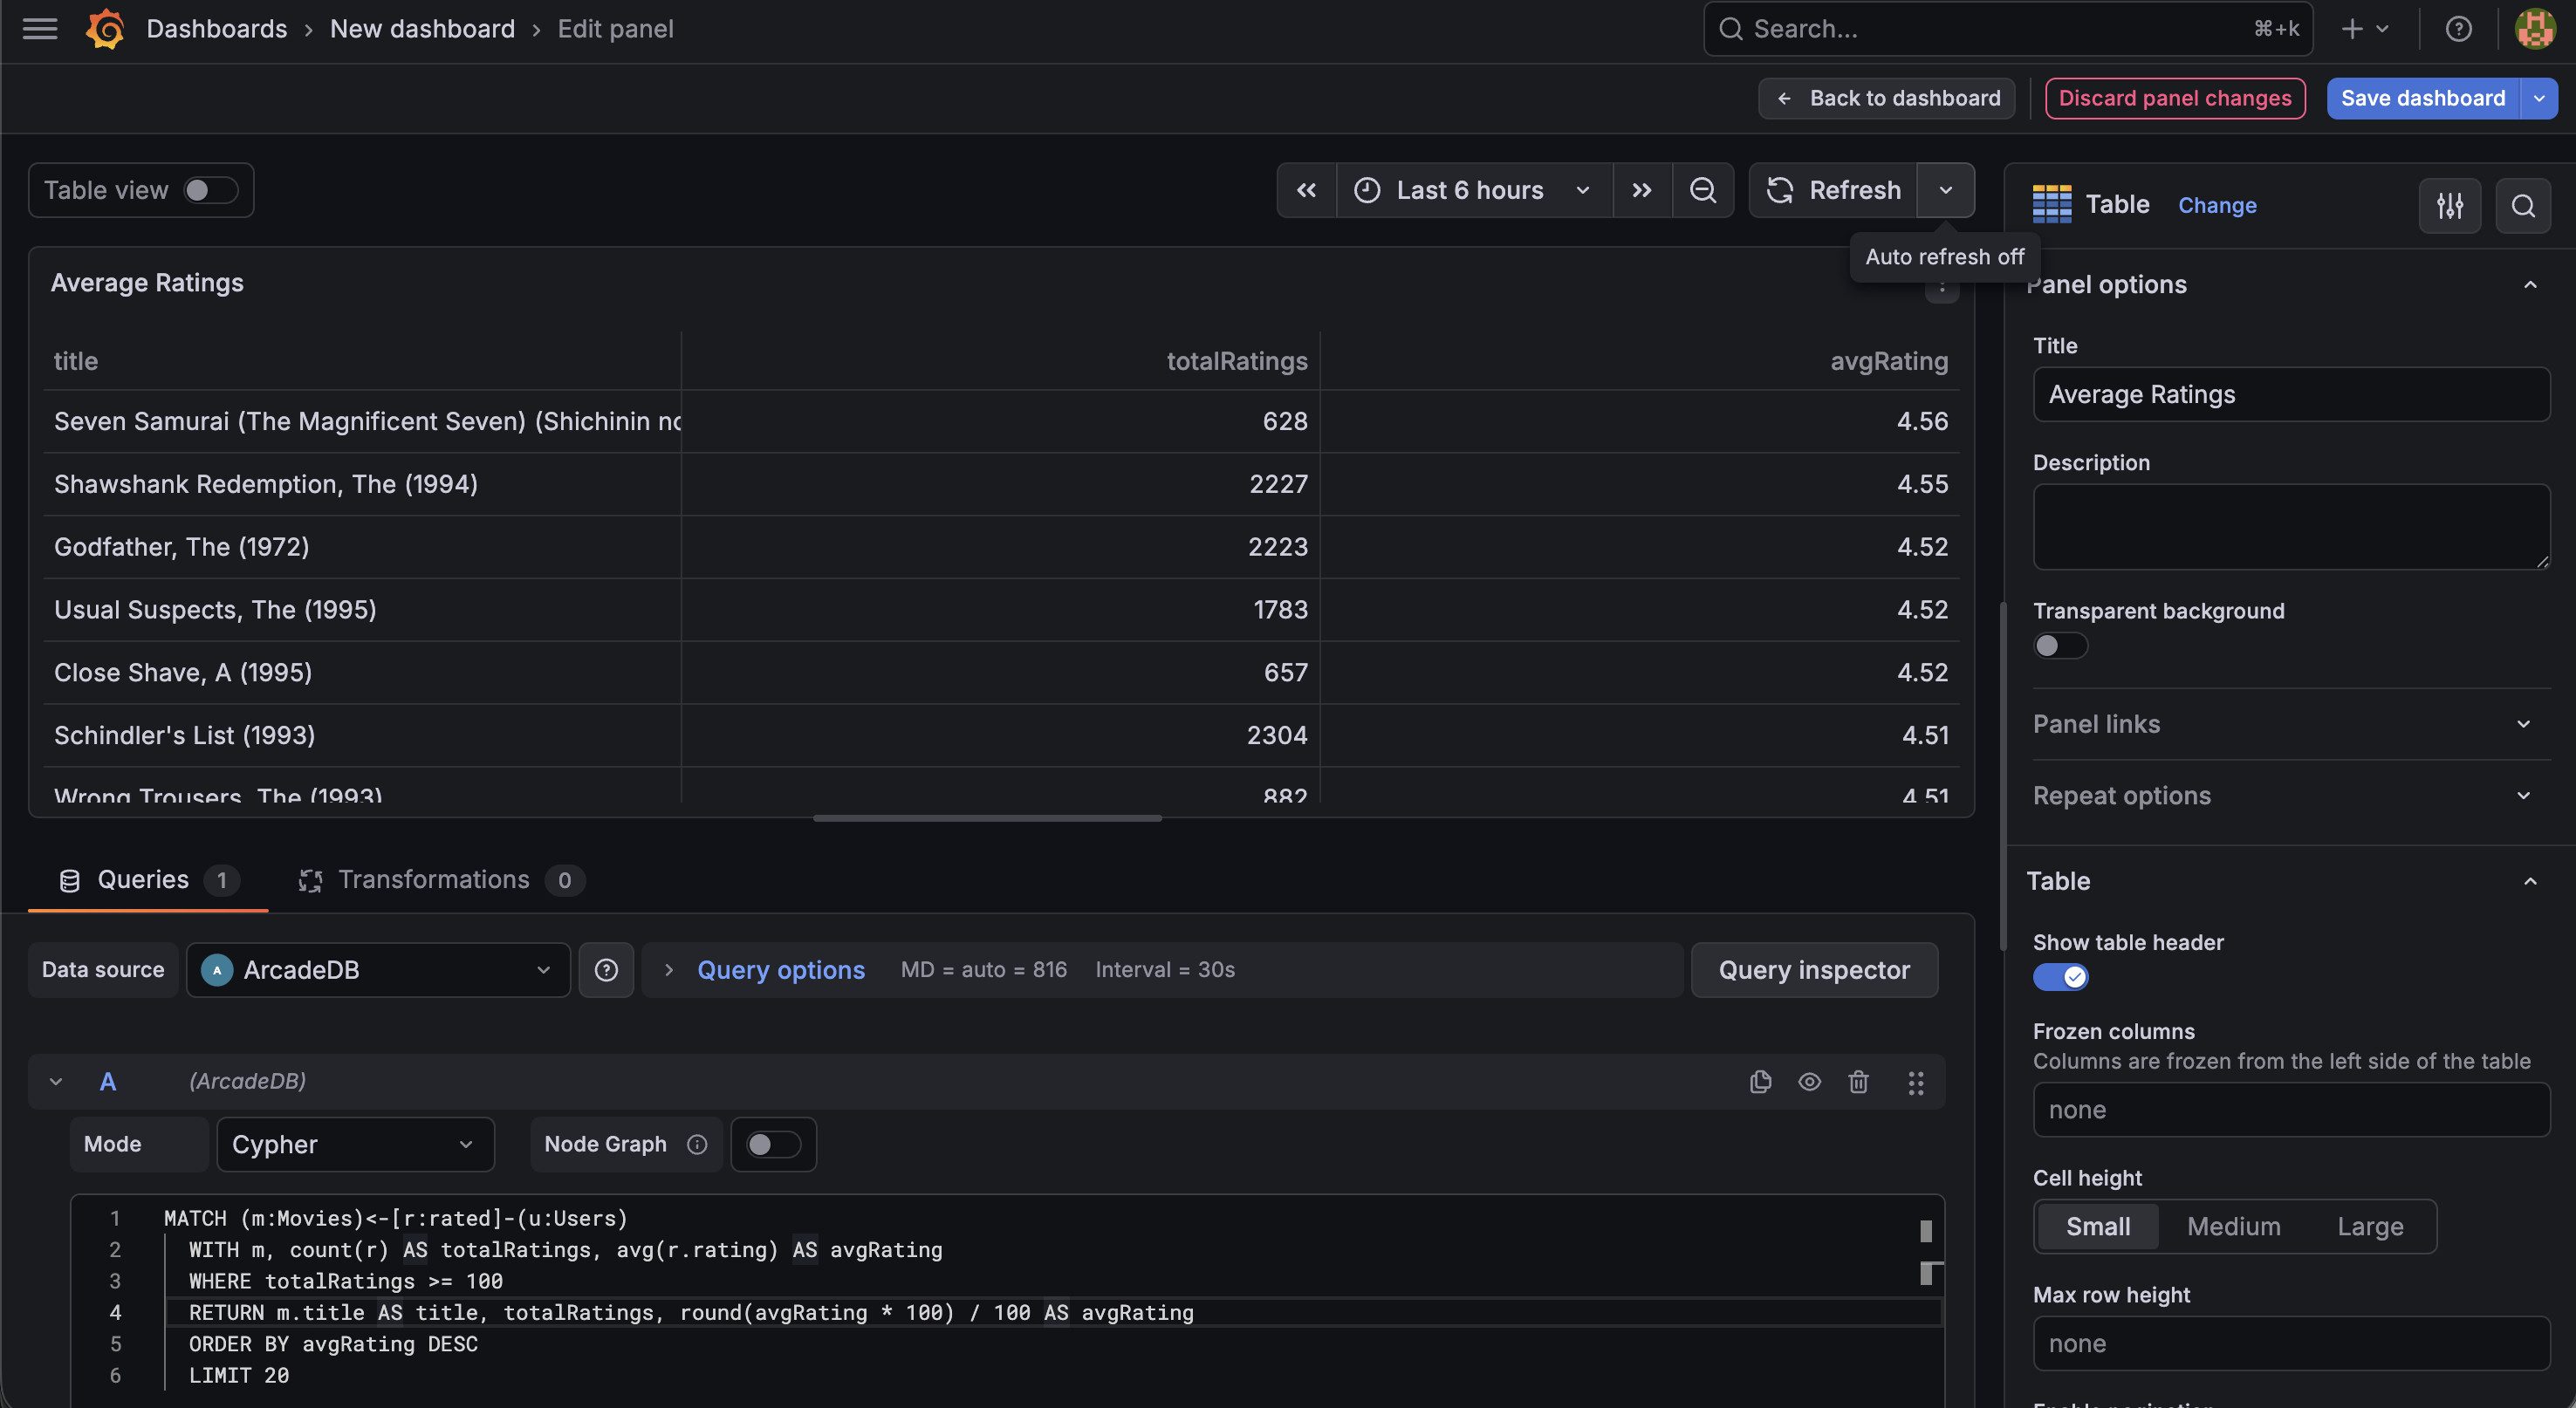
This Cypher query matches the pattern Movie <-- rated -- User, groups by movie, counts ratings, and computes the average. “Seven Samurai” and “The Shawshank Redemption” should top the list with averages above 4.5.
Step 6: Cypher Panel - Graph Visualization
Now the highlight - interactive graph visualization of movie-genre relationships.
- Add another visualization.
- Switch mode to Cypher.
- Enable the Node Graph toggle.
- Change the visualization type to Node Graph (search for it in the visualization picker).
- Enter this query to explore how top movies connect to genres:
MATCH (m:Movies)-[r:hasGenera]->(g:Genres)
WHERE m.title IN ['Toy Story (1995)', 'Star Wars: Episode IV - A New Hope (1977)', 'The Matrix (1999)', 'Pulp Fiction (1994)', 'Forrest Gump (1994)', 'Jurassic Park (1993)', 'The Silence of the Lambs (1991)', 'Fargo (1996)']
RETURN m, r, g
- Run the query.
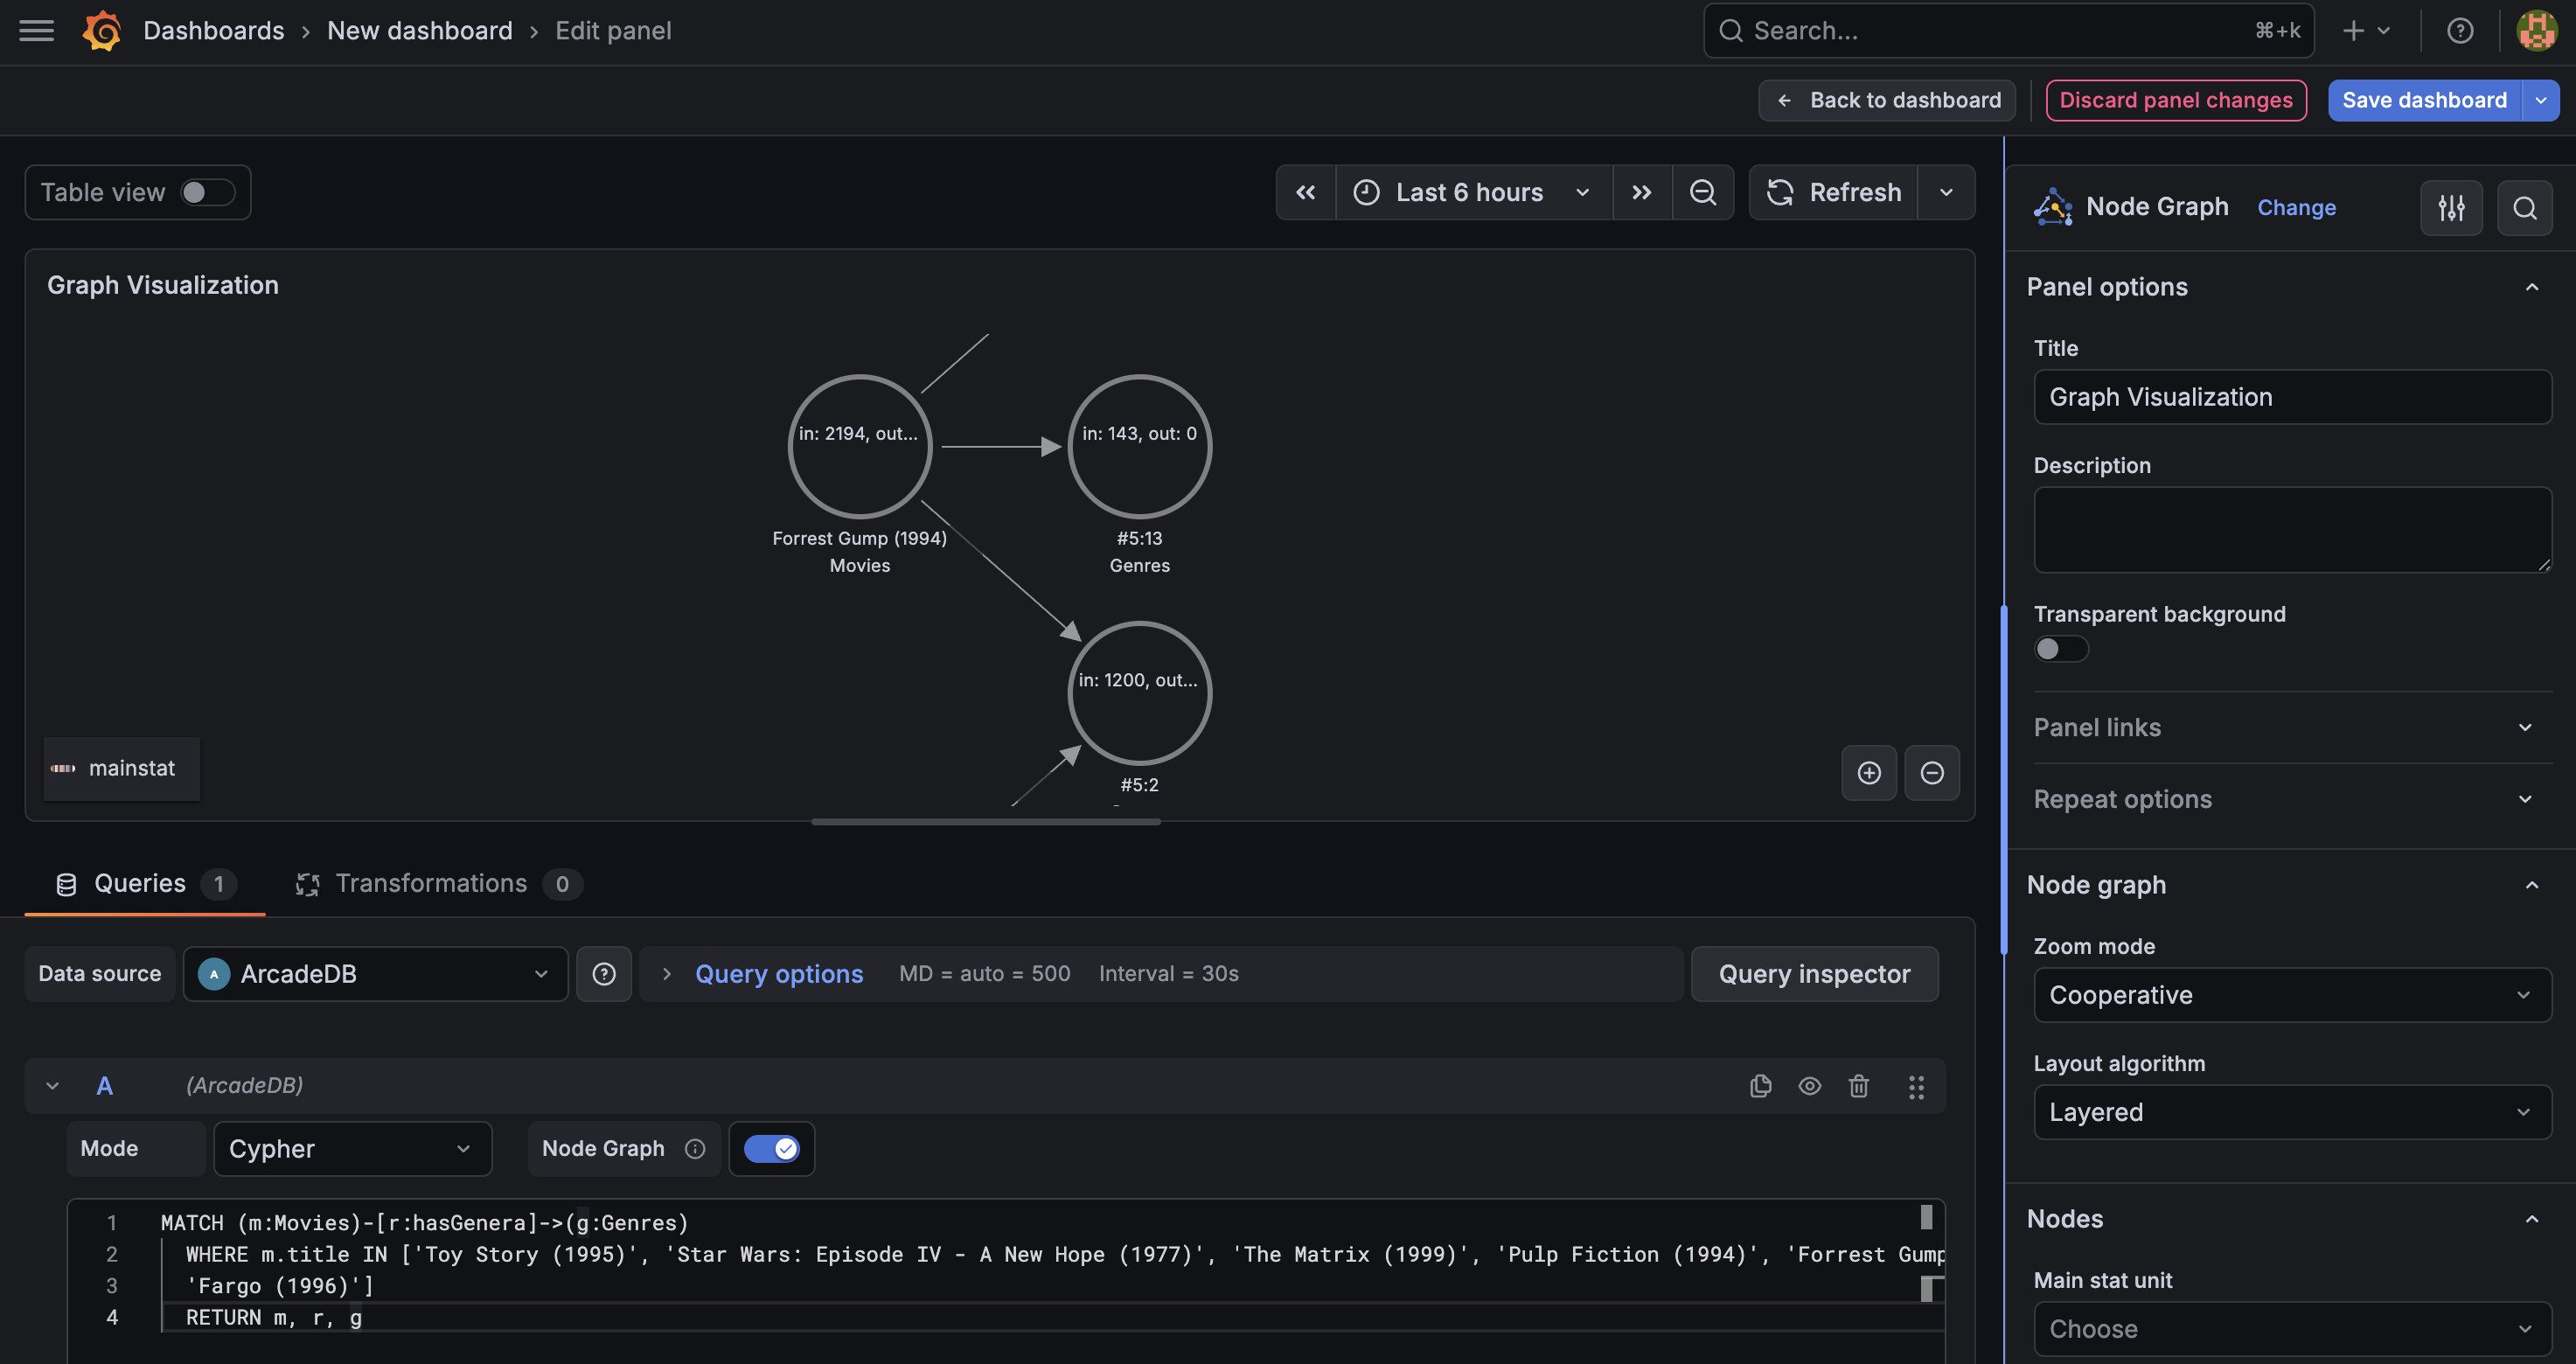
You’ll see an interactive network graph with:
- Movie nodes showing film titles
- Genre nodes showing categories like “Action”, “Comedy”, “Drama”
- Edges representing the hasGenera relationship
- Click any node to see all its properties in the detail panel
- Drag nodes to rearrange the layout
- Zoom and pan to explore the graph
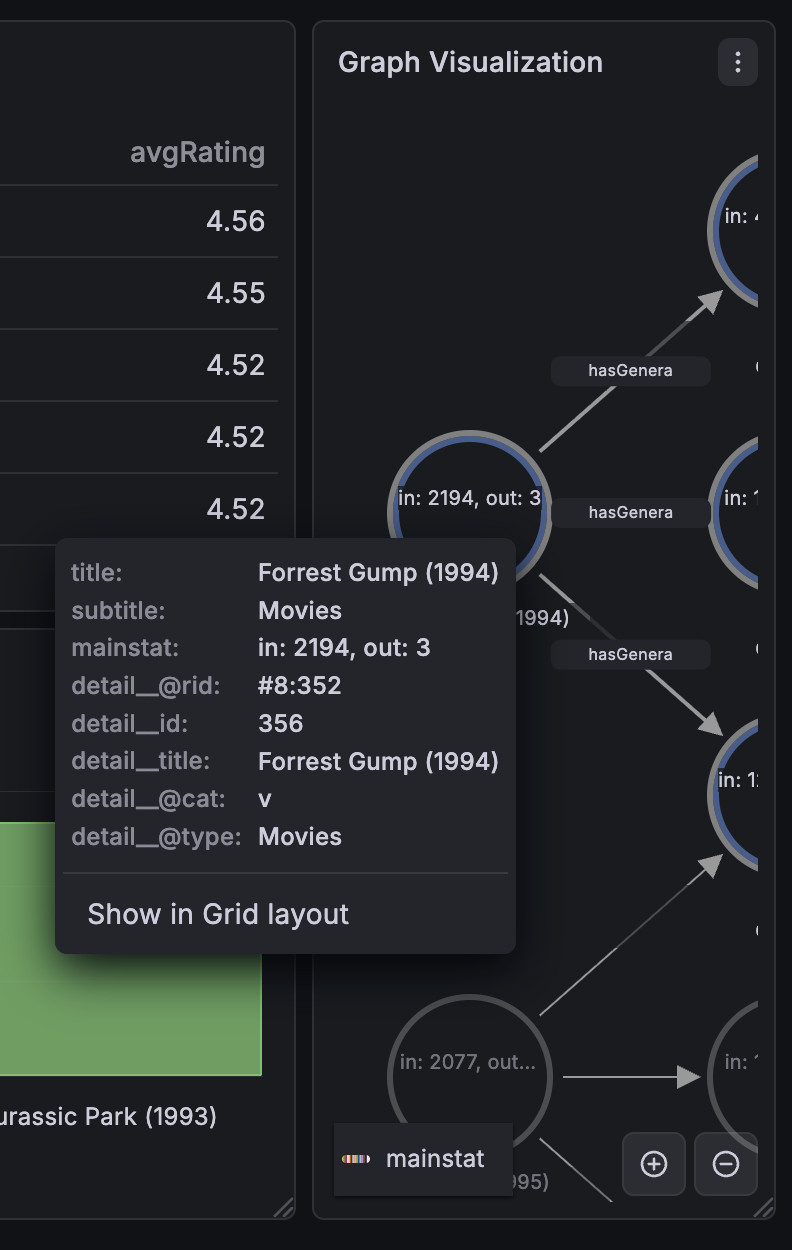
Step 7: Compose Your Dashboard
Arrange all three panels on your dashboard: the bar chart at the top, the ratings table in the middle, and the genre graph at the bottom.

Save the dashboard. You now have a multi-model BI dashboard that combines chart visualization, tabular data with graph traversals, and interactive graph exploration in a single view - something no other BI tool can do natively.
Beyond the Basics
Template Variables
Create dynamic dashboards with template variables. Add a variable backed by an ArcadeDB query:
SELECT description AS __text, description AS __value FROM Genres
Then use it in your panels to filter movies by genre:
SELECT m.title, in('rated').size() AS ratings
FROM Movies AS m
WHERE m.out('hasGenera').description CONTAINS '$genre'
ORDER BY ratings DESC
LIMIT 20
Users can switch genres from a dropdown at the top of the dashboard.
Alerting
Set up alerts on any query. For example, create an alert when the number of new ratings per hour drops below a threshold - useful for monitoring data pipeline health.
Because the plugin has a Go backend, alerts evaluate server-side - no browser needed.
ArcadeDB + BI: The Full Picture
The Grafana plugin is the centerpiece, but ArcadeDB also works with other BI tools through the PostgreSQL wire protocol. Any tool that supports PostgreSQL can connect to ArcadeDB on port 5432:
| Tool | Connection | Best For |
|---|---|---|
| Grafana | ArcadeDB plugin | Time series, graphs, alerting |
| Apache Superset | PostgreSQL (SQLAlchemy) | SQL Lab, charting |
| Metabase | PostgreSQL (JDBC) | Self-service BI |
| Tableau | PostgreSQL connector | Enterprise reporting |
| Power BI | PostgreSQL (ODBC) | Microsoft ecosystem |
| DBeaver | PostgreSQL (JDBC) | Database development |
The Grafana plugin provides the richest experience, especially for time series and graph visualization. The PostgreSQL wire protocol gives you breadth - connect any tool in your stack.
Getting Started
The plugin is open source (Apache 2.0) and available on GitHub:
- Repository: github.com/ArcadeData/arcadedb-grafana-datasource
- Installation:
grafana-cli plugins install arcadedb-arcadedb-datasource - Documentation: See the README for full configuration and usage details
- BI Integration Guide: The ArcadeDB documentation includes guides for connecting Grafana, Superset, Metabase, Tableau, Power BI, and DBeaver
Your data is more than rows and columns. Your dashboards should be too.