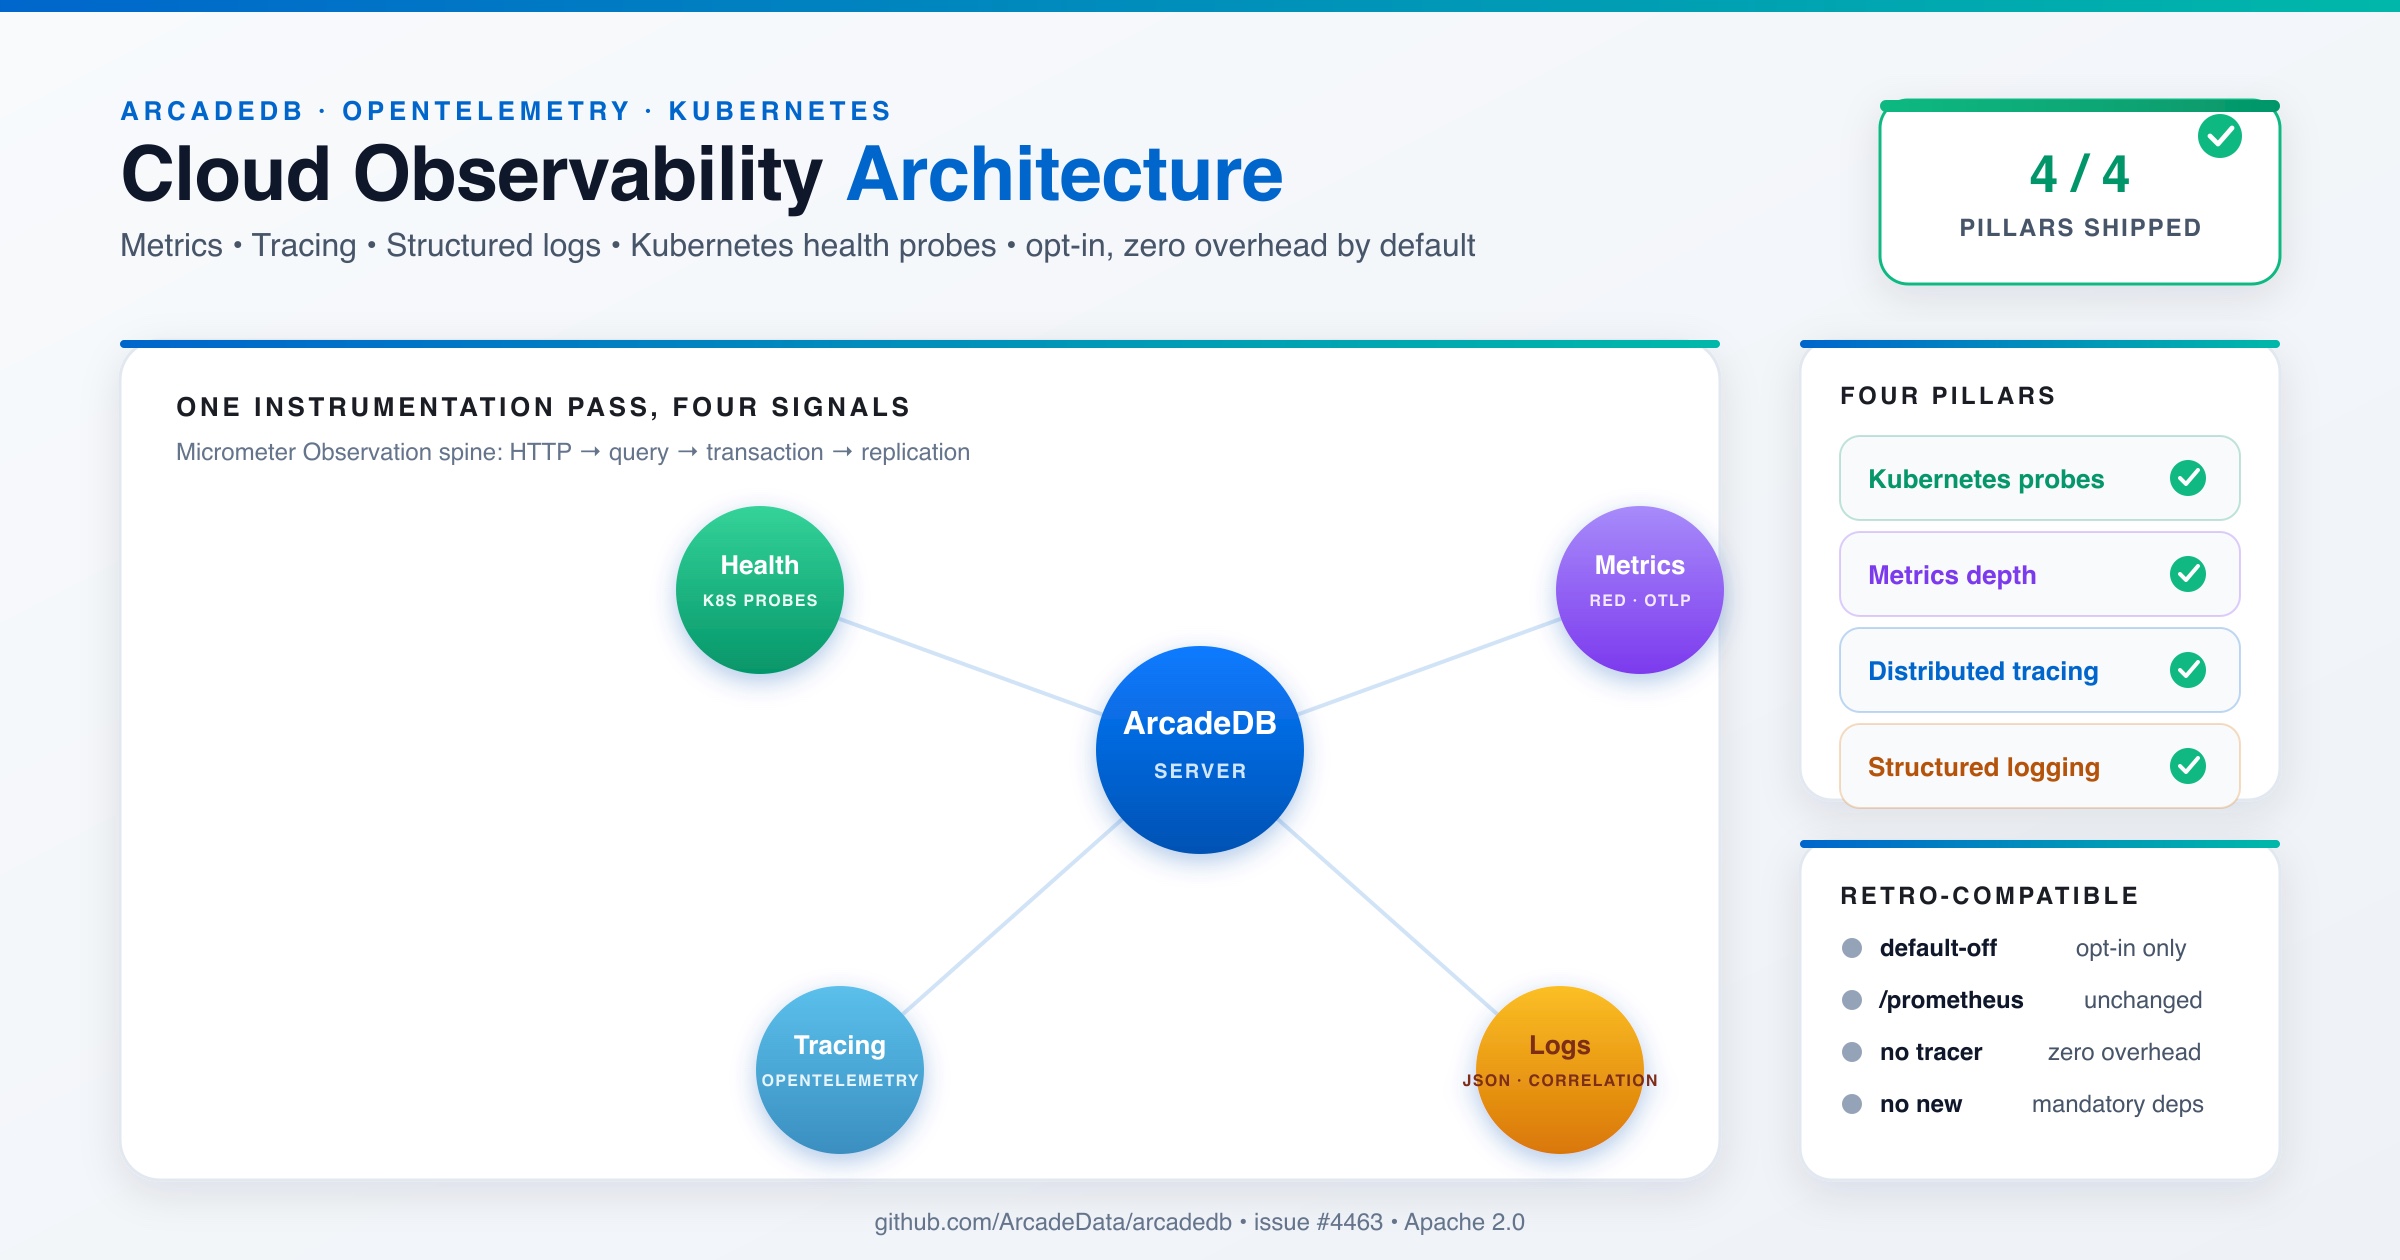
A database in Kubernetes has to answer two questions the orchestrator keeps asking: are you alive, and are you ready? It also has to answer the one an on-call engineer asks at 2am, which is why a query that normally takes 8ms just took four seconds. ArcadeDB could answer none of them well. The Cloud Observability Architecture work fixes that with four pieces that ship independently: health probes, deeper metrics with OTLP export, structured logging with correlation IDs, and distributed tracing over OpenTelemetry.
All of it is opt-in. Touch no configuration key and your server behaves exactly as it does today. For how the server is deployed in the first place, see the client-server page.
What was already there, and what wasn’t
Single-node observability was in decent shape: Micrometer metrics with an in-memory registry, an optional /prometheus endpoint, JVM and executor-pool binders, an engine Profiler that tracks cache hit ratio, pages, WAL, transaction counts, and MVCC conflicts, a manual query profiler, and an /api/v1/ready endpoint.
The gaps only show up once you put that server in a cluster. Query, command, and transaction latency lived in the manual profiler, which means you had to go looking for it; there were no always-on RED (Rate, Errors, Duration) timers and no percentile histograms. There were no spans at all, so a request that crossed the query engine, a transaction, and a Raft replication hop was three disconnected mysteries. Logs were text-only, with nothing tying a line back to the request that produced it. And there was a readiness endpoint but no liveness check, which is the one Kubernetes reaches for first.
Instrument once, get two signals
The part of this design I like most is the one that required the least new code. Micrometer’s Observation API lets you instrument a code path once and emit either a timer or a span from it, depending on what happens to be registered at runtime. ArcadeDB already shipped Micrometer, so the core server now wraps its hot paths (HTTP request handling, query and command execution, transaction commit, and Raft replication) in Observation calls and stops there.
With no tracer registered, an Observation is a metrics-only timer: what already happened, under a new name. Install the tracing plugin and those same call sites start producing spans as well. No second instrumentation pass, no parallel set of trace annotations drifting out of sync with the metric ones. If you have ever maintained a codebase where the metrics and the traces disagree about what a “query” is, you know why this matters.
Metrics: RED timers and OTLP export
Three always-on timers, with percentile histograms and SLO buckets, exposed through /prometheus and optionally through OTLP:
arcadedb.http.requests, tagged by method, path template, status, and database. The path template is deliberate: tagging by raw URI is how you blow up your cardinality budget and get a call from whoever pays the metrics bill.arcadedb.query.duration, tagged by language, database, and query type.arcadedb.tx.duration, tagged by database and outcome (commit or rollback).
A new EngineMetricsBinder, modeled on the existing PoolMetrics, pulls the engine Profiler’s cache hit ratio, page and WAL statistics, MVCC conflict counts, and the database-level and sparse-vector numbers into Micrometer gauges tagged by database. Set arcadedb.serverMetrics.otlp.enabled=true and the same series push to an OTLP collector. The Prometheus scrape path is not touched.
Tracing, in a module you can leave on the shelf
Tracing lives in a separate, optional tracing module, packaged the same way the metrics module already is: its own Maven module, provided scope on the server, loaded through the ServerPlugin SPI. The OpenTelemetry SDK, micrometer-tracing-bridge-otel, and the OTLP exporter stay inside it. The core server’s compile classpath never sees them, which was a hard requirement: nobody should inherit the OTel dependency tree because they wanted a graph database.
Set arcadedb.serverMetrics.tracing.enabled=true and the plugin registers a bridged tracer into Micrometer’s global ObservationRegistry. The Observations described above start producing spans, nested from HTTP down through query execution and transaction commit. Inbound requests continue an upstream trace through the W3C traceparent header, and outbound Raft RPCs propagate context, so a write is traceable from leader to follower.
Leave the jar off the classpath or the flag unset and it is a genuine no-op. No span overhead, no registry, nothing.
Structured logging and correlation IDs
A timer tells you the p99 moved. A span tells you which hop ate the time. Neither tells you about the IOException that got swallowed and retried, and that is usually the thing you actually needed. So the logs have to join the same conversation.
At the start of each request, ArcadeDB populates a diagnostic context with the active trace and span IDs, plus a generated request ID so correlation still works when tracing is off. The context is scoped per request and cleared in a finally block, because the server hands threads back to a worker pool and a leaked MDC entry means the next request inherits someone else’s trace ID. That bug is miserable to find. The finally is not decorative.
An opt-in JsonLogFormatter (arcadedb.server.logFormat=json) writes one JSON object per line: timestamp, level, logger, thread, message, trace ID, span ID, database, request ID, exception. It is built on ArcadeDB’s existing JSONObject, so it adds no JSON dependency. If you want correlation without moving to JSON, arcadedb.server.logIncludeTrace=true appends a [traceId=...] tag to the text format instead.
Health probes for Kubernetes
This is the smallest change in the whole set and probably the one most people will use: GET /api/v1/health. It is deliberately cheap. No database I/O, no auth, returns 200 as long as the process and the HTTP layer are up.
Cheapness is the entire point. Liveness must not depend on database readiness. Wire a readiness-style check into livenessProbe and Kubernetes will helpfully kill a node that is still replaying its WAL, then kill the replacement for the same reason, and you will spend an afternoon reading kubelet events before you work out that your health check is the outage.
/api/v1/ready is unchanged by default. It gains one optional behavior: with arcadedb.server.readinessRequiresHA=true and HA active, readiness reports false until the node has joined the Raft group and caught up. That gives clustered deployments a readinessProbe that means something.
livenessProbe:
  httpGet:
    path: /api/v1/health
    port: 2480
  initialDelaySeconds: 10
  periodSeconds: 10
readinessProbe:
  httpGet:
    path: /api/v1/ready
    port: 2480
  initialDelaySeconds: 5
  periodSeconds: 5
Configuration reference
Every new key defaults to off, or to what the server does today:
| Key | Default | Effect |
|---|---|---|
arcadedb.serverMetrics.otlp.enabled |
false |
Register an OTLP metrics registry alongside Prometheus |
arcadedb.serverMetrics.otlp.endpoint |
http://localhost:4317 |
OTLP metrics endpoint |
arcadedb.serverMetrics.tracing.enabled |
false |
Activate the tracing plugin (no-op if the jar isn’t present) |
arcadedb.serverMetrics.tracing.endpoint |
http://localhost:4317 |
OTLP trace endpoint |
arcadedb.serverMetrics.tracing.samplingRate |
0.0 |
Parent-based sampling ratio |
arcadedb.server.logFormat |
text |
json selects the structured JsonLogFormatter |
arcadedb.server.logIncludeTrace |
false |
Append [traceId=...] to text-mode logs |
arcadedb.server.readinessRequiresHA |
false |
Make /api/v1/ready HA-aware (Raft membership and catch-up) |
On not breaking anything
The whole design was built against one constraint: with no new configuration, an upgraded deployment behaves exactly as it did before. Existing endpoints and response shapes (/prometheus, /api/v1/server, /api/v1/ready) were added to, never modified. No configuration key was renamed. No new mandatory dependency lands on the core server, which is why the OpenTelemetry SDK sits behind the SPI in its own module rather than in the server pom.xml where it would have been considerably easier to put it.
Upgrade whenever you like, then turn things on one flag at a time.
Pairing it with Grafana
If you already run the ArcadeDB Grafana plugin for BI dashboards over SQL, Cypher, and Gremlin, the OTLP metrics and traces drop into the same stack. Point an OpenTelemetry Collector at the server, fan out to Prometheus and Tempo (or whatever your vendor of the month is), and you can go from a p99 spike on a dashboard to the trace behind it to the log line that explains it, without leaving the cluster.